 Invest Intelligence When It Realy Matters
A Closer Look at Poverty
Originally published in the September 2012 Intelligent Investor (expanded to include previous publications)
Although poverty rates have been high in the United States for over a decade, they have increased appreciably since the economic crisis.
As first detailed in America's Financial Apocalypse, the official poverty rate has been suppressed by numerous means.
In August 2004, the U.S. Census Bureau reported a poverty rate of 12.7 percent. This was the rate used by government economists and politicians to determine expenditures for numerous government programs. However, the Census Bureau added that this rate could be as high as 19.4 percent or as low as 8.3 percent depending on how income and basic living expenses were treated.
I for one feel that the real poverty rate in America is much closer to the 19.4 percent figure (and most likely even higher) due to the unwillingness of Washington to update its criteria for poverty levels.
And over the next two decades, as the majority of America’s estimated 76 million baby boomers are expected to retire in poverty, the real poverty numbers could easily surpass 30 percent (more on this in Chapters Eight and Nine). According to the U.S. Census’ conservative formula for poverty, in 2004 there were:
• 37.0 million Americans in poverty (12.7%), up from 35.9 million (12.5%) in 2003• 7.9 million American families in poverty (10.2%), up from 7.6 million in 2003
As defined by the Office of Management and Budget and updated for inflation using the Consumer Price Index, the average poverty threshold for a family of four in 2004 was an income of $19,307; for a family of three, $15,067; for a family of two, $12,334; and for unrelated individuals, $9,645.
How is it that record oil prices have not allowed for upward adjustments in these levels? Keep in mind that inflation of basic necessities such as food, energy, and healthcare affects the poor by a much larger factor than wealthier Americans because they have less to spend on other items. Thus, inflation of basic necessities becomes a tax on low- and middle-income Americans.
In late 2010, when the media reported the latest poverty data from the Census, an analyst from the Brookings Institution made a key statement.
…the state comparisons may not be very fair. They make no provisions for differences in living costs. I think we need to revise the poverty measure to take into account regional cost differences.
I discussed this myself in 2006, well before the "geniuses" at Brookings even had a clue an economic collapse was coming, in America’s Financial Apocalypse. Let’s have a look.
Consider that it’s almost impossible for a single person to survive today in America with an annual income of $10,000; roughly the national minimum wage. The only exception might be if they live in the Deep South. And if they are surviving, they certainly don’t have funds needed to advance their employment options.In many regions of America such as California, New York, and New Jersey, $10,000 per year won’t even cover your government-assisted housing, food and utilities. And you certainly won’t have anything left over for incidentals, such as laundry, clothes, transportation, etc.It seems odd that the poverty level is not adjusted for the living expenses of each city or state since this would account for regions with higher living expenses. As it stands today, the government’s formula for poverty is only applicable to states with the lowest cost of living such as West Virginia, Mississippi, Arkansas, and Alabama. Yet, even in these states, poverty levels are quite high according to Washington’s conservative criteria. How many Americans living in larger, more costly metropolitan areas are making more than the government’s poverty level, yet are not counted in its official numbers?In most areas of the United States, it takes roughly double the federal poverty level to provide a family with basic necessities such as food and housing, according to the National Center for Children in Poverty. Based on the government’s conservative data, nearly 40 million Americans are literally on the verge of being homeless. But if appropriate adjustments for basic living costs were made, the poverty level could easy be 80 percent higher than reported levels. Even with all the tricks government agencies use to hide the truth, they still can’t dispute that poverty is on the rise.America’s poorest 10 percent has less purchasing power than almost every other developed nation. Meanwhile, its wealthiest 20 percent own almost 80 percent of all household wealth (figure 4-5). And compared to other developed nations, America has the largest income gap between the top 10 percent of income earners and the median income, as well as the largest gap between median income and the lowest 10 percent of income earners.
Source: America’s Financial Apocalypse, 2006.
Finally, the U.S. government does much less to help raise the living standards of its impoverished citizens compared to other developed nations.
What was once a nation of fairness, opportunity and moderation has become a nation of favoritism and extremes. Some view America’s economic strength to be confirmed by the annual growth of new millionaires. However, this has come at the expense of shifting more Americans into poverty or near poverty.

Source: America’s Financial Apocalypse
I have also discussed these points in previous publications. See here and here.
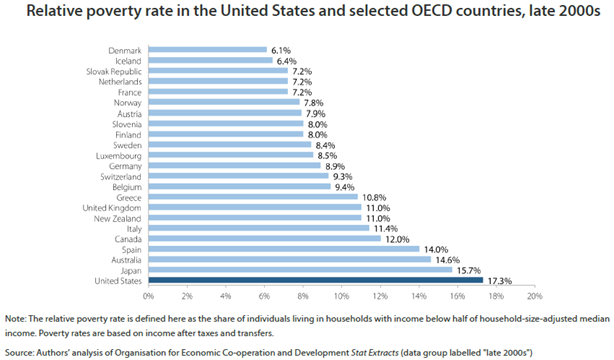
Regardless of these outdated criteria for poverty, even the current official rate of nearly 50 million is a startling figure. But it becomes more worrisome when viewed relative to other developed nations.
The first chart shows the ratio of earnings (which are comprised exclusively of wages) at the 10th percentile of the earnings distribution to earnings of the median worker. This metric compares how workers at the bottom 10% fare compared to the typical worker.
As illustrated, earnings at the 10th percentile in the U.S. are less than half of those of the typical worker. This is by far the lowest in peer nations. But since median earnings vary from country to country, this data alone is not as informative as we would like.
The second chart shows the earnings of the lowest 10th percentile relative to those in the U.S. As you can see, only in Japan, New Zealand, Italy, Spain, France and Greece have earnings in the lowest 10th percentile less than those in the U.S. when adjusted for media earnings.
This data is made worse when one considers the inequity seen in the U.S. When it comes to measures of poverty, the U.S. leads peer nations in overall poverty rates and childhood poverty.
So why are poverty rates so high in the U.S.?
There are many plausible reasons for this. Part of the explanation is related to income inequality, which is related to minimum wage laws, the continued weakness in labor unionization and collective bargaining arrangements, the tax code, strength of the economy, government transfer, and other variables.
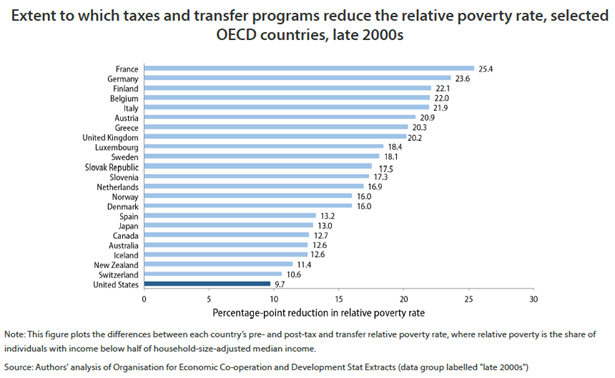
Perhaps the most obvious reason for the high rate of poverty in the U.S. is due to the lower level of government assistance relative to other nations. In short, the safety net in the U.S. contains many gaps which adversely affect the impoverished.
In the fifth chart we examine how taxes and transfer income affect poverty rates.
The final chart shows the total social expenditure as a share of GDP for the U.S. and peer nations plotted against their post-tax and transfer poverty rates. Thus, this chart relates poverty more directly with the extent of social spending.
As you can see, the U.S. has the highest rate of poverty and one of the lowest levels of social expenditure.
Advocates of America’s so-called “free market system” argue that the impoverished simply do not wish to take advantage of all of the opportunities available in the U.S. These individuals claim that most of America’s impoverished citizens simply do not want to put forth the effort to obtain higher education and they would rather live off of welfare than work. However, generally speaking this is simply not the case.
The fact is that the United States no longer offers the same level of opportunity as it did three decades ago. This is specifically why it ranks next to last in inter-generational mobility among OECD countries.


.png)
.png)


